
Tutorial for the SAGA database Retrieval subsystem
This tutorial explains the meanings of the options and columns displayed on the retrieval subsystem and shows how it works.
Top page

-
A-1: Date of the last update of the SAGA database in JST
-
A-2: Button to execute search
-
A-3: Button to set search example (currently not working)
-
A-4: Button to reset the form
- B-1: Option to plot on 2D diagram or histogram
- B-2: Bin width for the histogram
- This works when Histogram option in B-1 is chosen.
- B-3: Range of values of the histogram
- This works when Histogram option in B-1 is chosen.
-
B-4: Category or Unit of the axis for plotting as shown below
-
B-5: Quantity or Element of the axis
-
B-6: Quantity in text format. [Fe/H], [C/Fe], [C/N], … any combinations of [X/Y ] are supported.
-
B-7: Allowed range for specified quantity. Set blank if unset.
-
B-8: Options to choose if the data with upper limit is included or excluded.
- B-9: Options to show or hide error bars on the plot
-
C-1: Search by object name. Names such as “HE0107-5240”, “CS”, and “0107” are allowed.
-
C-2: Subtract binary stars with the specified range of binary period.
-
C-3: Criterion for the range of photometric magnitude for selected photometric band.
-
C-4: Criterion for the resolution power, R.
-
D-1: Search by authors.
- Family Name, Given Name or Initial Middle Name or Initial: Given Name and Middle Name can be omitted.
- First author search by “^”.
- All the names and initials are case insensitive.
- Given name and middle name can be connected by hyphen.
-
D-2: Bibliographic search to include data
- Format must be “Journal, Volume, Page, Year”.
- Any criterions can be omitted.
- D-3: Bibliographic search to exclude data
- Same option as to include data
- D-4: Criterion to choose the journal.
- D-5: Criterion for the published year of original journal.
-
E-1: Cross search option. Choose if the combination of data across papers is allowed or not.
- same paper: allow to retrieve data for X and Y axes only from the same paper
- any combination: allow to retrieve data for X and Y axes from any combinations of papers
- plot one: plot only one data if more than one data are available with the same paper option. The data selection is subject to the formula that defines the priority of the data.
-
E-2: If yes, select data only from the abundances with the adopted solar abundances are provided in the original papers. Otherwise, all the data are searchable.
-
E-3: Reference solar abundances. Abundances are converted using the reference solar abundances.
-
E-4: How to choose the representative values if two or more data are available from the literature.
- mean: mean of all the available data
- median: median of all the available data
- subject to priority parameter: data to plot is selected by the criteria.
- E-5: Number of display per result page.
- E-6: Check to display items
- Plot data: data plot and download files
- Output text data: download link to text format for selected data
- Output search result: data table to provide links to data
- Output data comment: additional comment on reference in the numerical data
- Output uncertainties: add information on uncertainties in the result pages and downloadable text data
         C-rich : [C/Fe] ≥ 0.7
         RGB : Teff ≤ 6000 and log g ≤ 3.5
         EMP : [Fe/H] ≤ -2.5
         CEMP-s : C-rich and EMP and [Ba/Fe] ≥ 0.5
         CEMP-no : C-rich and EMP and [Ba/Fe] < 0.5
Data plot

-
A-1: Plotted data are automatically classified into categories according to the following criteria.
-
EMP: stars with [Fe/H] ≤ -2.5. Although the value of [Fe/H] depends on the observations, it is simply taken from the data in the most recent published paper, the largest resolution for observing set ups, and the smallest error bars. Fe I is preferably adopted for identical paper.
-
C-rich: stars with [C/Fe] ≥ 0.7. The selection condition of the data is the same as for EMP. “CEMP” means “C-rich” and “EMP”.
-
RGB: stars with Teff ≤ 6000 K and log g ≤ 3.5. Otherwise, the star is classified as “MS”.
- CEMP-s: stars that satisfy C-rich and EMP criteria and [Ba/Fe] ≥ 0.5.
- CEMP-no: stars that satisfy C-rich and EMP criteria and [Ba/Fe] < 0.5.
-
-
A-2: Number of plotted data (top) and Pearson coefficient for plotted data (bottom). In calculating the coefficient, data with upper limits are excluded.
-
A-3: Arrows show the upper limits for derived values.
-
A-4: Panel is the clickable map. Each plotted data has a link to the page to see more information on the selected object.
-
B-1: Option to set title of the figure
-
B-2: Option to specify the position of the legend or unset the legend
-
B-3: Option to set labels for X- and Y-axis.
-
B-4: Option to set the scale of the figure in linear or log
-
B-5: Option to set the range of values. Use “*” for automatic scale.
-
B-6: Option to Include or exclude error bars on the diagram.
-
C-1: Button to replot the data
-
C-2: Button to reset the form
-
C-3: Button to delete all the list of plotted data
-
C-4: Button to destroy all internal set-ups and go to top page
- C-5: Checkboxes to show or hide in the plot
- C-6: Text form to set legends
- C-7: Pull-down menus to set the size of the points
- C-8: Pull-down menus to choose the symbols of the points
- C-9: Links to text data
- D-1: Checkbox to plot in color or black-and-white
-
D-2: Links to the current figures in different format
-
D-3: Button to download all the data and script to reproduce the figure.
-
E-1: Button to download data table in tab-separated file
- E-2: List of columns to be included in the text file
- E-3: Options to specify the number of columns to be added to the text file
Text Data Download
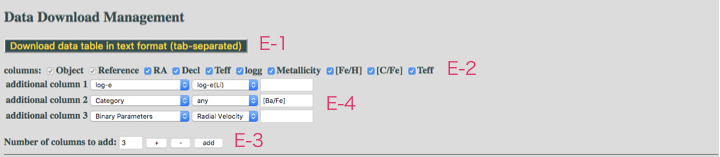
- E-4: Selection of additional columns in the text file
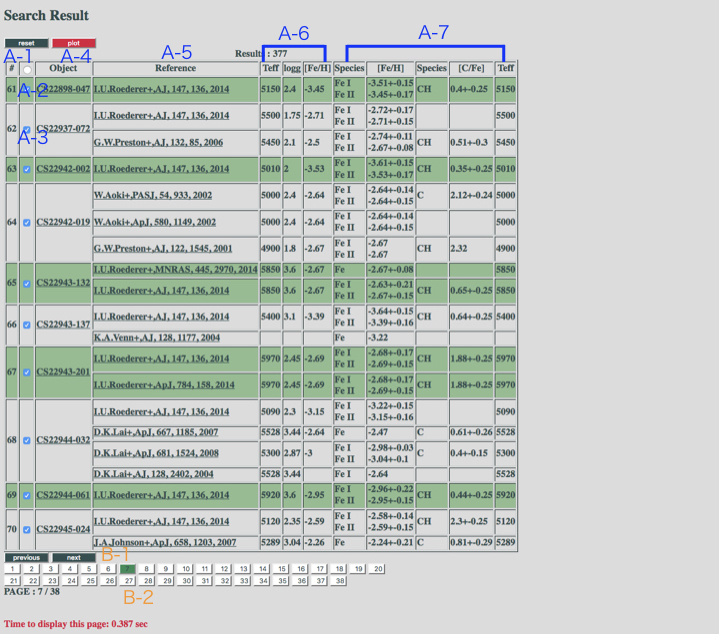
Search Result
-
A-1: ID of the object, sorted by star ID
-
A-2: Radio button to select all the checkboxes to plot the data for objects in the same page
-
A-3: Checkbox to plot the data
-
A-4: Link to the information on object
-
A-5: Link to the information on reference
-
A-6: Metallicity, Effective temperature, and Surface gravity of the object adopted by the paper.
- A-7: Values of X-axis, Y-axis, and criterion axes derived by the paper
-
B-1: Button to go to next or previous page
-
B-2: Buttons to change the page. The current page is shown by the green button.